In the exploration and analysis of geochemical data, traditional methods may not always suffice. This blog post will introduce a new way to process geochemical data effectively, leveraging modern software tools. By following these steps, you can enhance your data processing capabilities and improve the accuracy of your geochemical interpretations.
📝 Step 1: Intro
Welcome to the world of geochemical data processing! In this tutorial, we will explore step-by-step how to clean, normalize, and analyze geochemical data. This approach combines different software tools such as Excel, RapidMiner, Weka, CoDa, and Surfer to achieve comprehensive results. Let's get started!
📋 Step 2: Table of Content
Before diving into the details, it's essential to have a structured approach. Here’s a brief overview of the steps we will cover:
- Cleaning
- Normalization
- Erosion
- Anomalies
- Classification
- Tree View
- Limitations
- Interpretation
- Classifications
🧼 Step 3: Cleaning
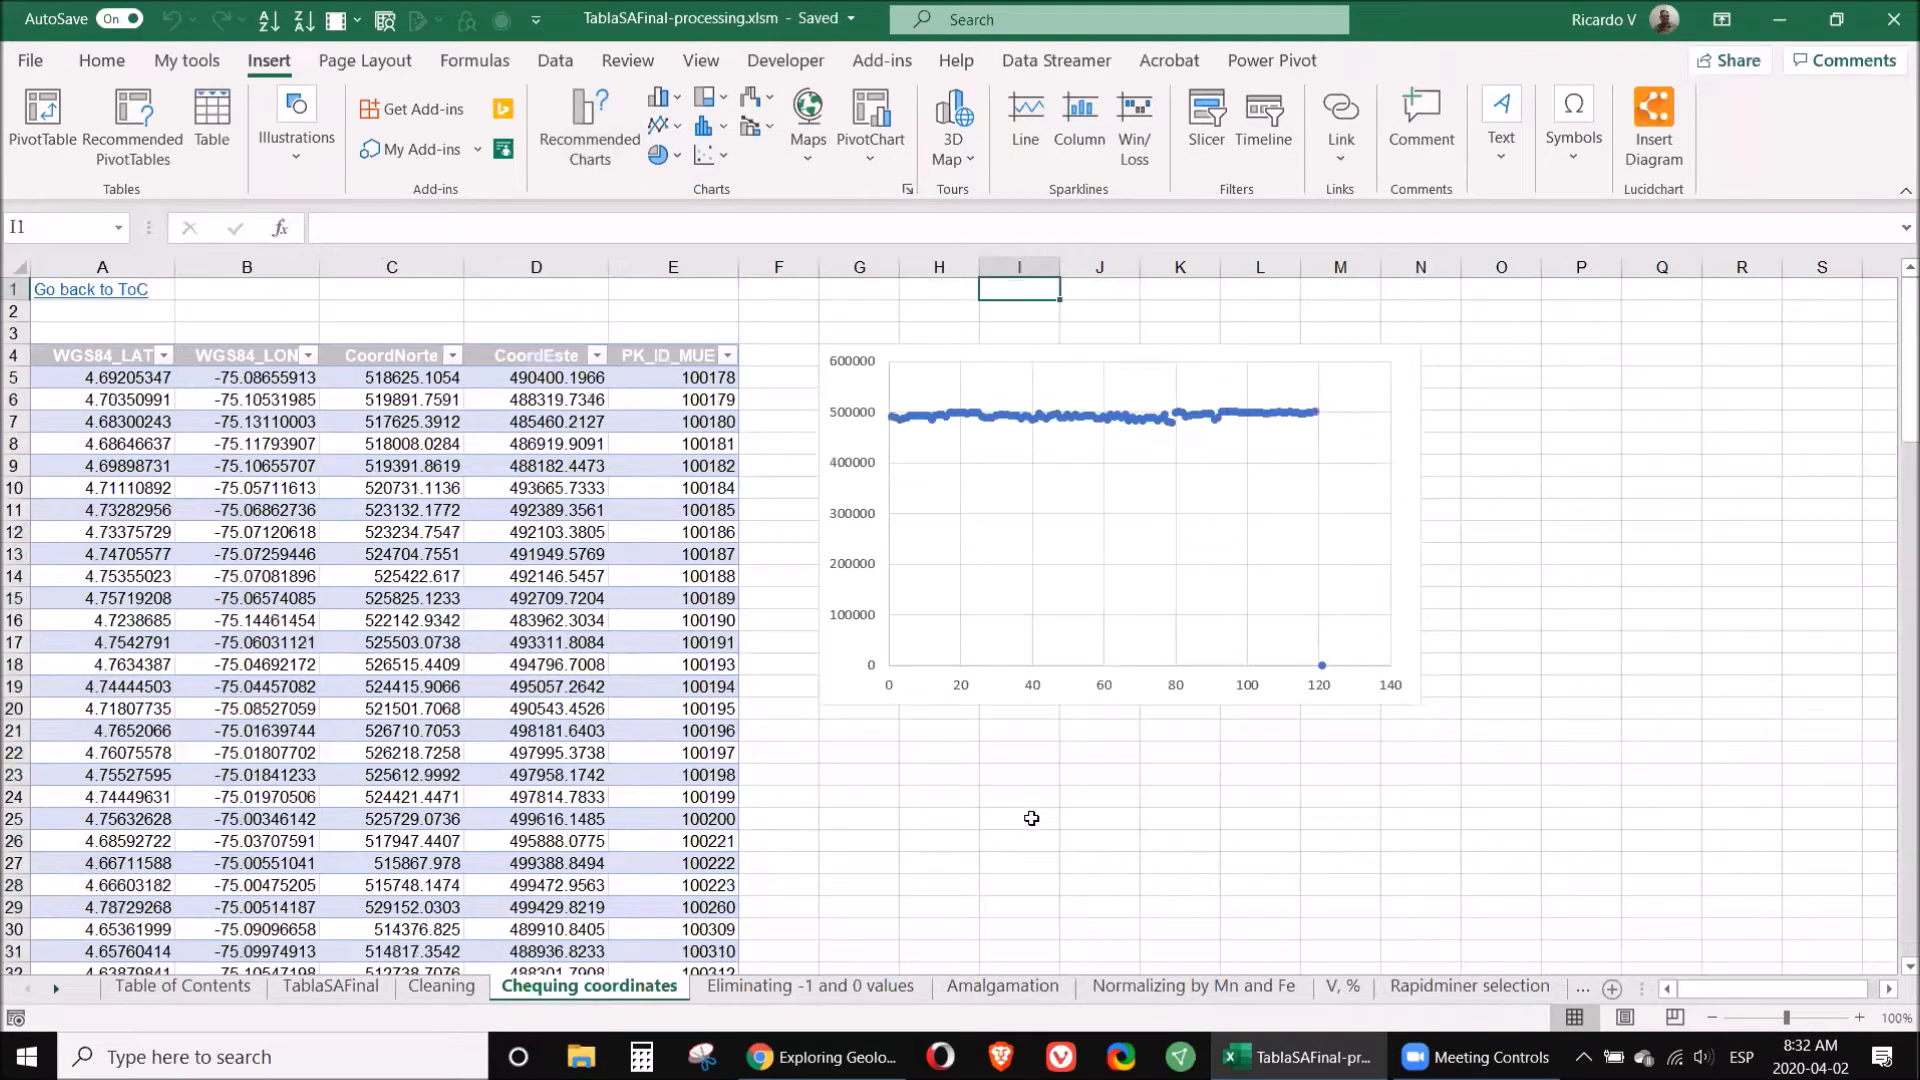
The first step in processing geochemical data is cleaning. This involves removing unnecessary columns and ensuring that only relevant information remains. Start by identifying the sample number, parameters, and coordinates that are essential for your analysis.
To check for coordinate accuracy, create a new table with your coordinates, select the relevant columns, and insert a chart. This visual representation will help identify any discrepancies. For instance, if a sample's coordinates are missing a digit, it's crucial to rectify this by contacting the data provider or removing the sample if necessary.
Additionally, eliminate any rows with zeros or negative values, as these typically indicate data below the detection limit or unmeasured samples. Always retain the original data format to allow for future revisions.
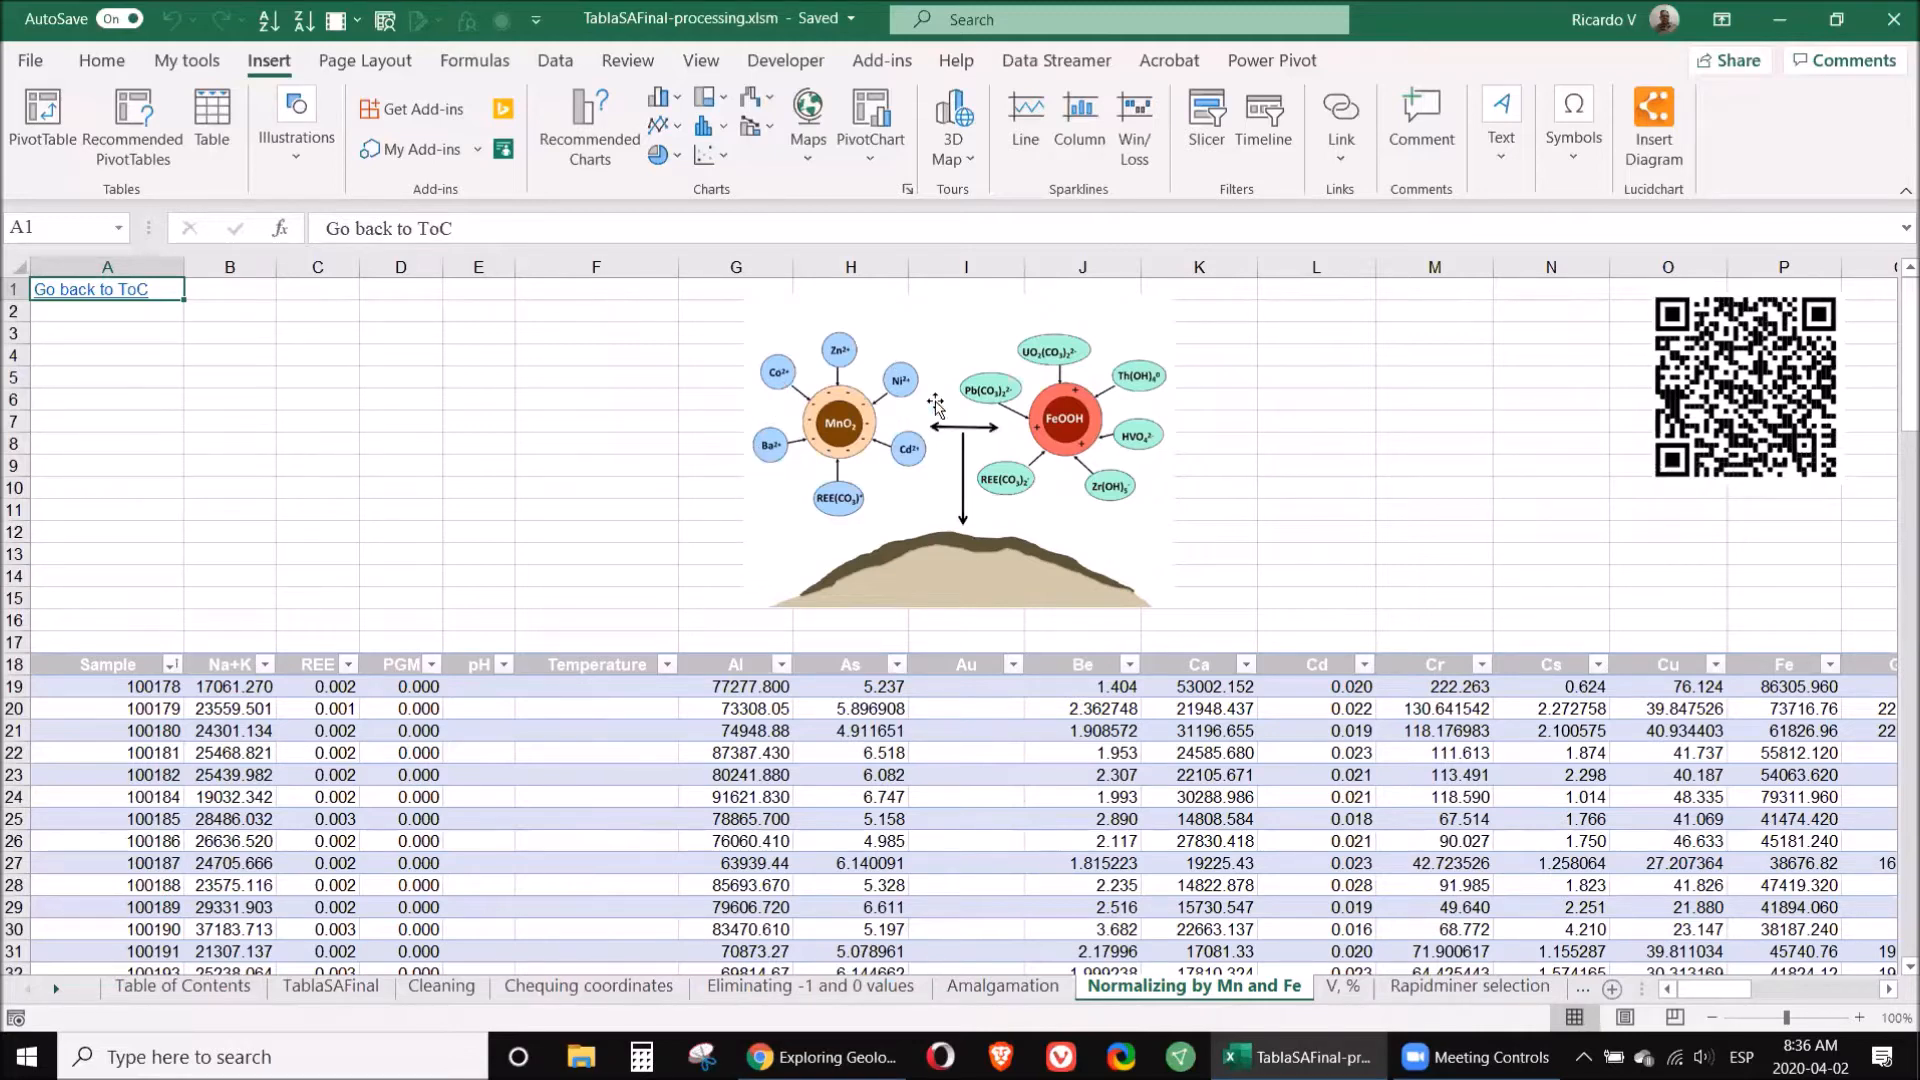
🔄 Step 4: Normalization
Normalization is a critical step to ensure that the data is comparable across different elements. This involves adjusting values based on a common reference, usually the concentrations of manganese and iron. The aim is to mitigate any anomalies caused by precipitation reactions that might skew results.
To normalize your data, divide each element's value by the corresponding manganese or iron value. This adjustment will provide a clearer picture of the true concentrations present in your samples.
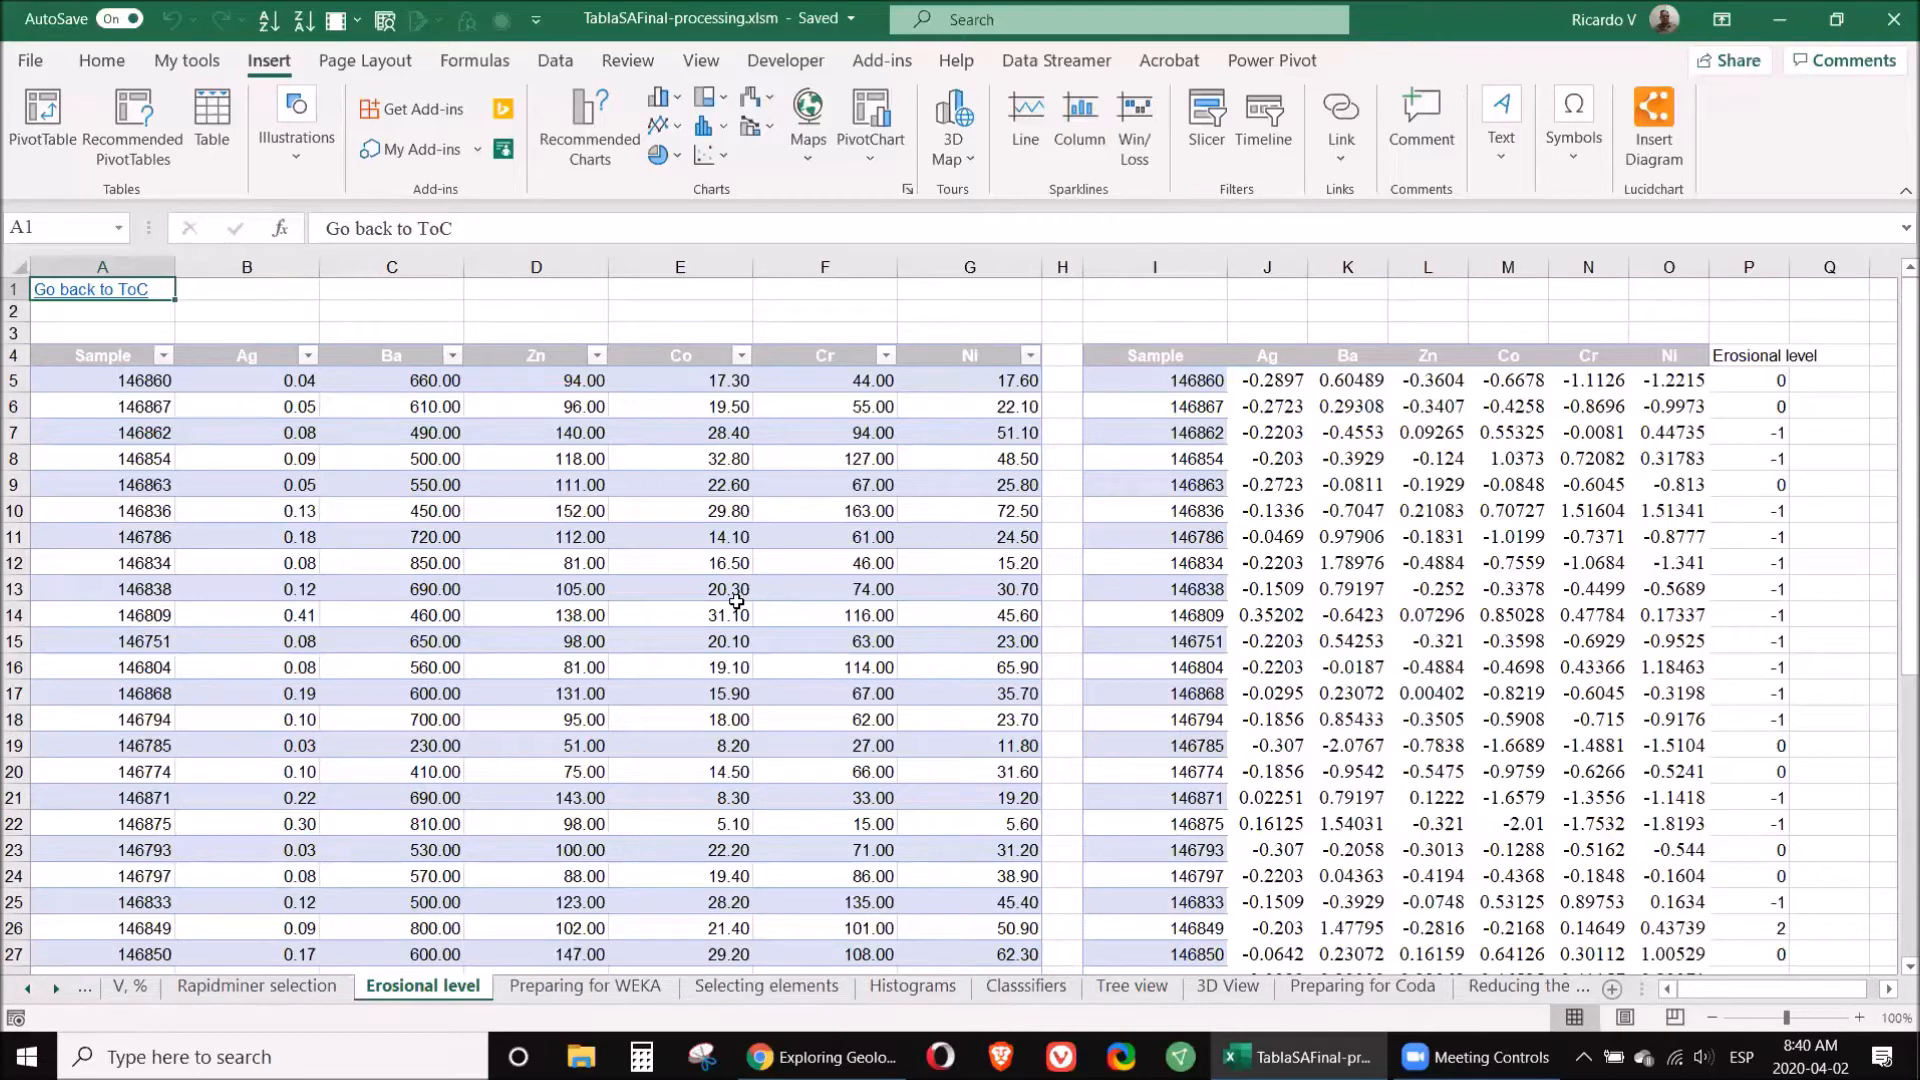
🏞️ Step 5: Erosion
Understanding the erosional level of your samples is vital as it can indicate the presence of previously existing ore bodies. Different elements tend to accumulate at various levels in the geological profile. For example, supra-mineral elements such as silver and mercury are typically found above ore deposits, while infra-mineral elements like nickel and cobalt are located below.
To assess erosional levels, calculate the coefficient of supra to infra elements. A value significantly greater than one suggests that the sample is situated in a promising area, whereas a lower value indicates that you might be exploring in an already eroded zone.
📊 Step 6: Anomalies
Identifying anomalies in your data is crucial for targeting potential mineralization. Use statistical methods to flag samples that deviate significantly from the norm. This can be achieved through standard deviation analysis, where samples are compared against the average to identify outliers.
Utilizing software like RapidMiner can enhance this process, allowing for a more sophisticated analysis of which elements show the most significant variability. This step ensures that you focus on the most promising samples for further exploration.
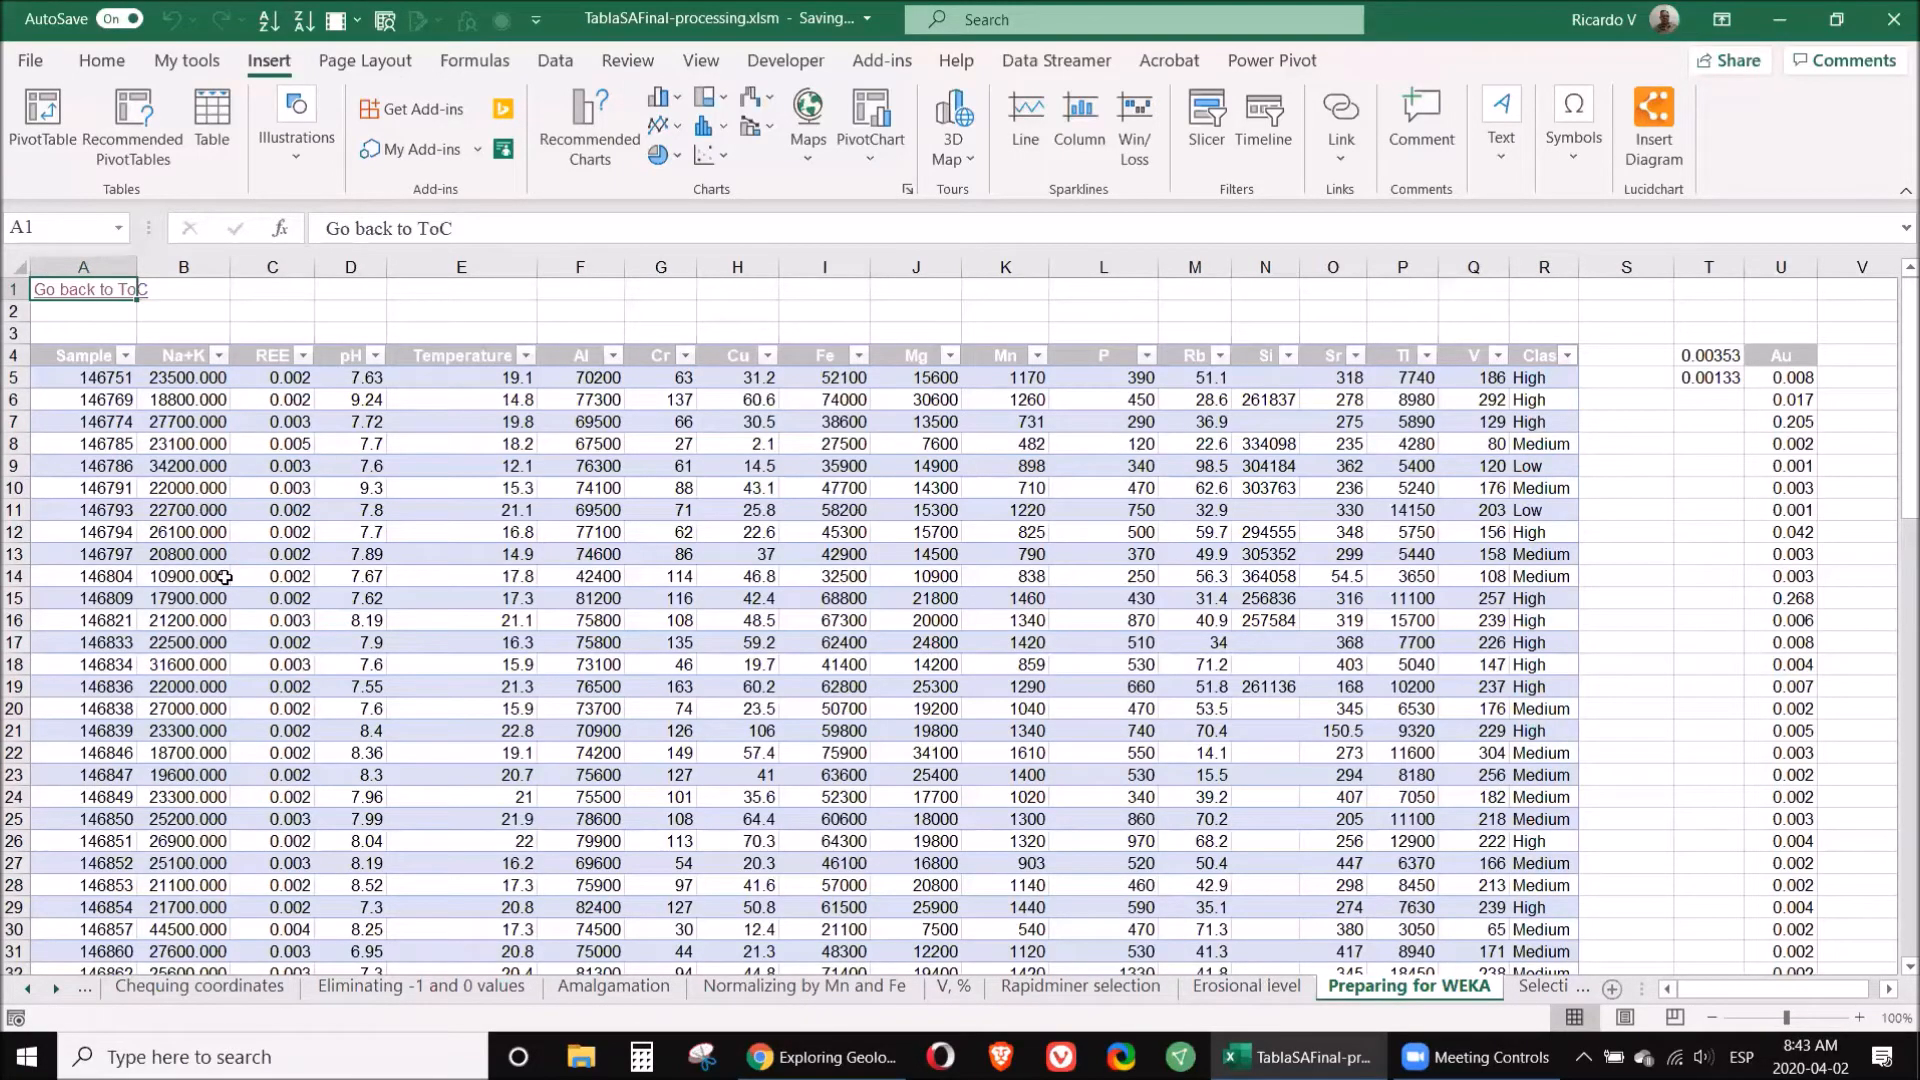
🔍 Step 7: Classification
Once you have cleaned and normalized your data, the next step is classification. This involves categorizing your data based on specific criteria, such as the concentration of gold or other target elements. Use quartile analysis to categorize samples into high, medium, and low classes based on their values.
For example, if a sample's gold value exceeds the third quartile, it can be classified as high. This classification will aid in determining which samples warrant further analysis.
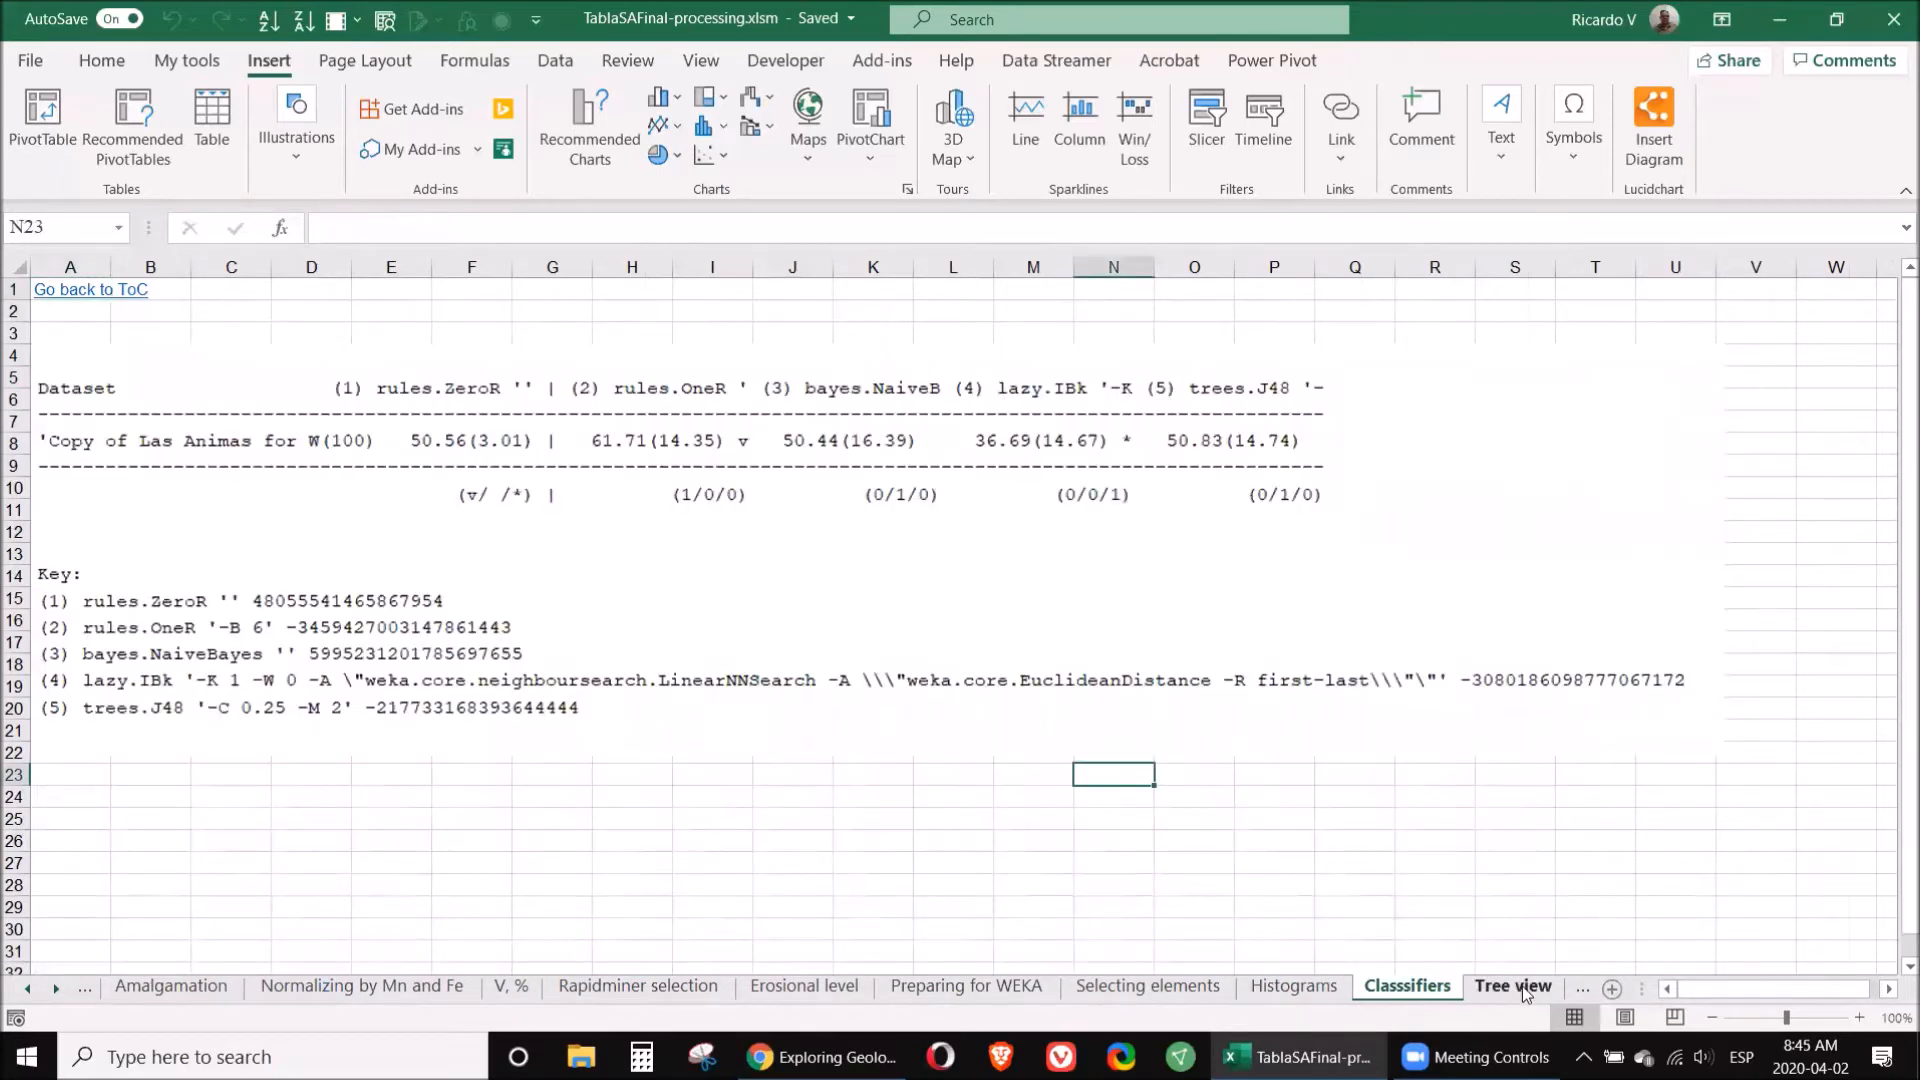
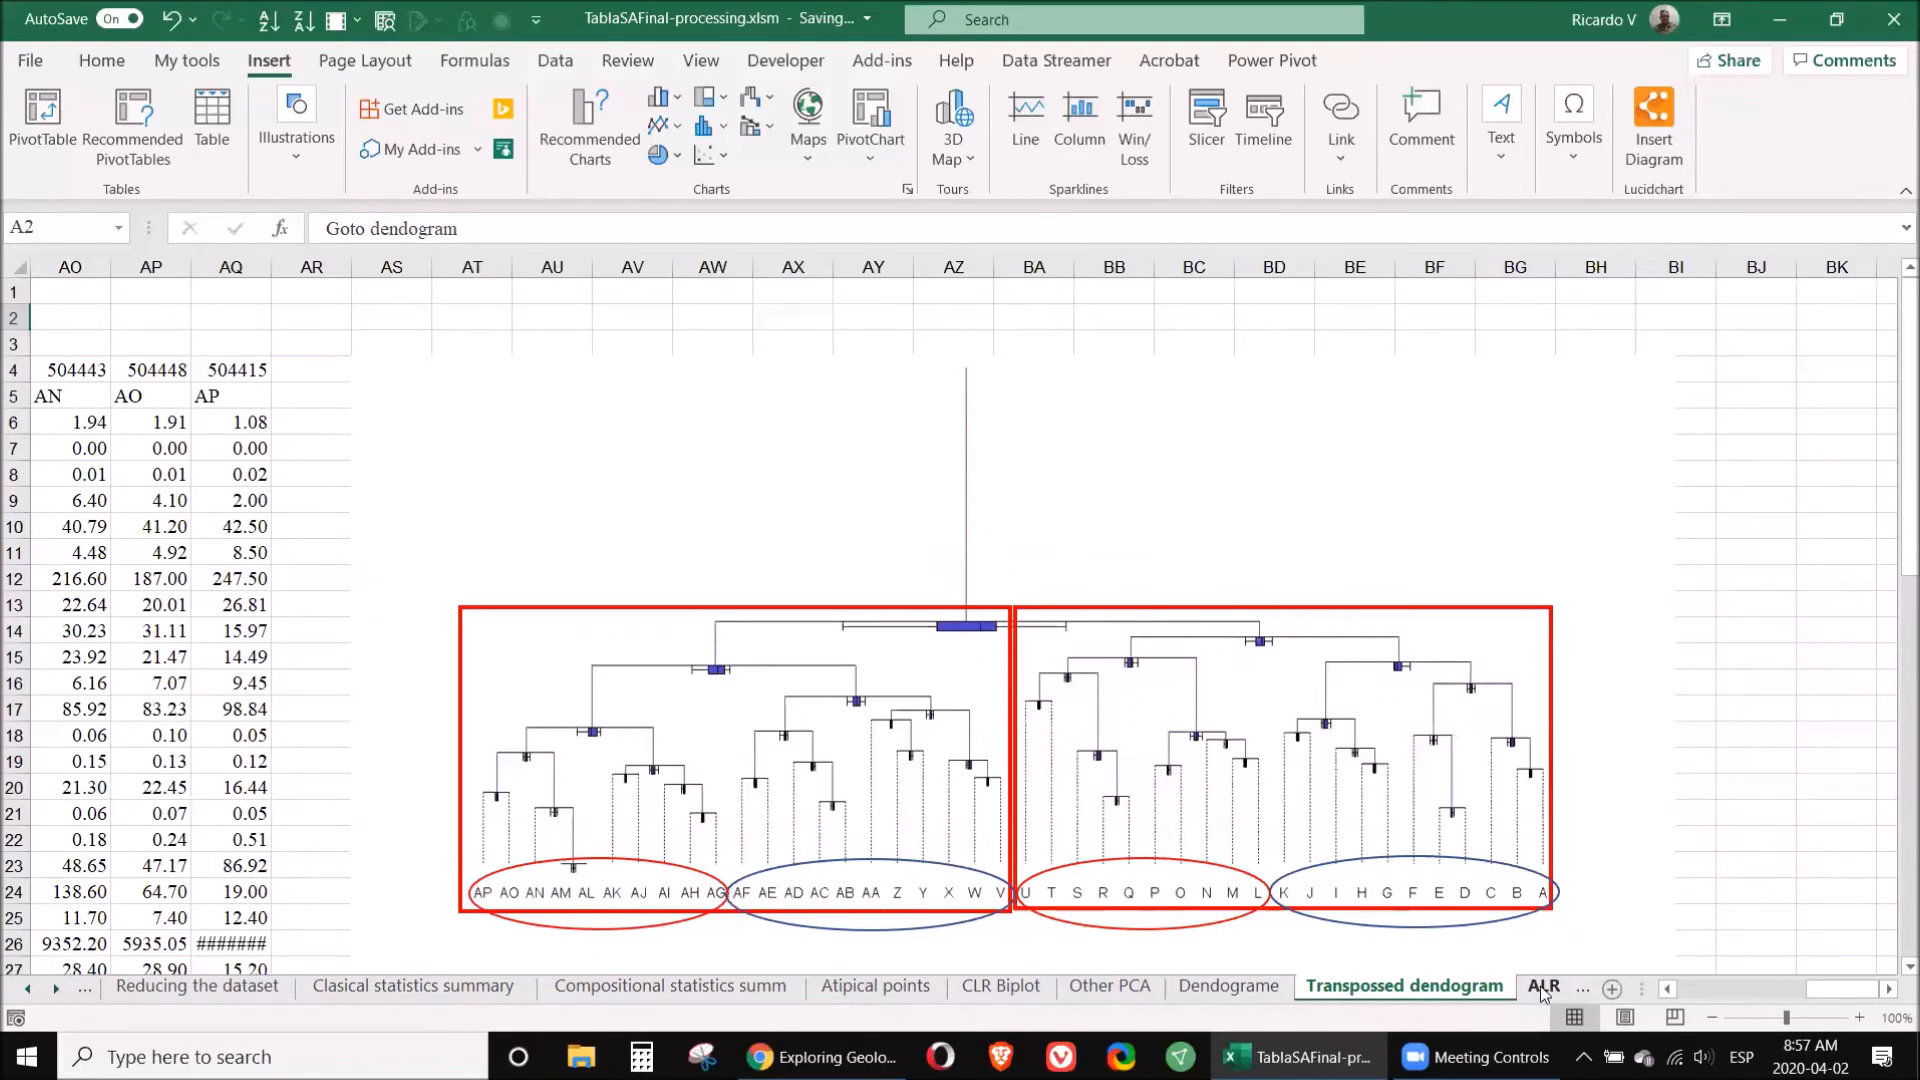
🌳 Step 8: Tree View
Utilizing a tree view can provide a visual representation of your classification results. This technique helps in understanding the relationships between various elements and identifying patterns within your data. The tree view allows for a clear depiction of how different samples cluster based on their elemental composition.
⚠️ Step 9: Limitations
While the methods discussed are powerful, it's essential to recognize their limitations. Data quality is paramount; any errors in the original dataset can lead to inaccurate conclusions. Additionally, the choice of software and algorithms can influence the results, so it's crucial to select the right tools for your specific needs.
🧭 Step 10: Interpretation
The final step in processing geochemical data is interpretation. This involves synthesizing all the information gathered through cleaning, normalization, and classification to draw meaningful conclusions about your samples. Consider the geological context, such as the type of mineralization and potential sources of the elements detected.
📚 Step 11: Classifications
In this step, you will apply the classifications made earlier to guide your exploration efforts. By understanding which samples are high in valuable elements, you can prioritize your sampling strategy and focus on areas with the highest potential for discovery.
❓ FAQ
What software do I need to process geochemical data?
You will need software tools such as Excel, RapidMiner, Weka, CoDa, and Surfer to effectively process and analyze your geochemical data.
How do I clean my geochemical data?
Cleaning involves removing unnecessary columns, correcting any errors in coordinates, and eliminating samples with invalid data points. Always keep a copy of the original data for reference.
What is normalization in geochemical data processing?
Normalization adjusts the values of different elements to a common reference point, usually based on manganese and iron concentrations, to ensure comparability across the dataset.
How can I identify anomalies in my data?
Use statistical analysis, such as standard deviation calculations, to identify samples that significantly deviate from the average concentrations. Software like RapidMiner can assist in this process.
What should I do if I encounter limitations in my data?
Recognize that data quality and software choice are crucial. Always validate your data and be cautious of any potential errors that could affect your conclusions.
By following these steps, you will be equipped to implement a new way to process geochemical data effectively. Embrace these modern techniques to enhance your exploration efforts and improve your findings.
For further reading and resources, consider accessing the ORCID link for additional materials and insights.
P. Geo. Ricardo A Valls, M. Sc.
Valls Geoconsultant
ORCID ID- https://orcid.org/0000-0002-5421-0914
Scopus Author ID: 7003369619/35335510700
ResearcherID: S-6604-2018
If you like this content, please "buy me a coffee" https://www.buymeacoffee.com/goldendroplets
#planetearth #geology #mining #exploration #education #earthscience #geologia #earthscienceteacher #cienciasnaturales #cienciasgeologicas #geochemistry #geochemistrybooks #geoquimica #trainingcourses #teachingonline #vallsgeoconsultant #vallsvg #technotectonics #goldendroplets #geovoices

No comments:
Post a Comment